TUSCALOOSA, Ala. — Extreme floods across the continental United States are associated with four broad atmospheric patterns, a machine-learning based analysis of extreme floods found.
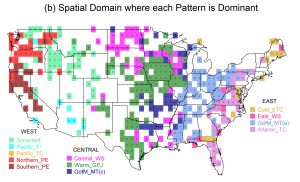
Researchers analyzed relatively rare floods in the United States, using a machine-learning algorithm to place the floods into groups based on atmospheric patterns that happen at the same time. They found that tropical moisture exports, tropical cyclones, low-pressure systems and melting snow are the primary patterns associated with extreme floods.
The findings are published in Scientific Reports. Dr. Hamid Moradkhani, the Alton N. Scott Endowed Professor of Engineering and director of Center for Complex Hydrosystems Research at The University of Alabama, is a co-author on the paper.
“This is the first time that atmospheric patterns have been linked to extreme floods in an automated fashion at the continental scale,” Moradkhani said.
Lead author on the paper is Dr. Katherine E. Schlef, a postdoctoral researcher at Consortium of Universities for the Advancement of Hydrologic Science in Cambridge, Massachusetts, who worked closely with Moradkhani and Dr. Upmanu Lall, from Columbia University.
“We are very excited about the insights on flooding and atmospheric circulation that we have gained from this research, and we look forward to further exploring how these insights can be useful to the flood risk assessment and management communities,” Schlef said.
The researchers developed an interactive website with detailed information about extreme floods across the continental U.S.
“The website is open for anyone to access, and we hope it will be widely used by a variety of agencies and individuals,” Moradkhani said.
The results of this analysis provide valuable insights for improved flood risk preparation and management. For example, the four main categories of atmospheric patterns could guide enhancements of weather forecasting models to improve flood prediction, management of water resources and emergency preparedness.
“Knowing where extreme floods tend to occur at the same time over a large region highlights where it would be beneficial to design flood control structures that account for both the regular flood season and an extreme flood season that occurs at a different time of year,” Moradkhani said.
The researchers used self-organizing maps, a type of artificial neural network that performs unsupervised clustering, to identify dominant atmospheric circulation patterns associated with extreme floods across the U.S.
The process found 12 circulation patterns grouped in four broad categories. Broadly, the results showed large events usually occur in the western and central U.S. because of tropical moisture exports and in the eastern U.S. because of tropical cyclones.
With the data, weather forecasters and managers of water reservoirs, along with emergency management personnel, can better prepare for extreme floods that have a likelihood of occurring at the same time as the dominant atmospheric patterns.
Contact
Adam Jones, UA communications, 205-348-4328, adam.jones@ua.edu
